Election Influence & The Power of Prediction
Nov 4, 2024

The Kickoff
Hello to our community of data enthusiasts and market innovators! November's newsletter brings fresh perspectives—from what’s next at Quanted to insights from industry leaders, surprising market connections, and practical tips for econometric modeling. Let’s get into it!
The Compass
Here's a rundown of what you can find in this edition:
A rundown of what's next for us
A surprising link between S&P & the US Elections
Timely insights to keep you in the loop on all that's happening now
How to make econometric models work for you
A fascinating paper that introduces a novel approach to handling stochastic processes
A fact we bet you did not know about the US Elections
Insider Trading
This month at Quanted has been marked by dynamic strides in data integration and exciting developments in our fundraising journey. Our ongoing commitment to enrich the Quanted Data Bridge is set to reach new heights as we integrate an extensive pipeline of esteemed data vendors. This addition will significantly enhance the analytical capabilities available to our users, allowing for more detailed and expansive insights.
In addition to broadening our data sources, we are excited to introduce a newly developed user interface designed to streamline the management of panel data. This update simplifies the extraction of actionable insights, enhancing the efficiency of our platform.
In parallel with our product advancements, we are thrilled to announce the launch of our pre-seed fundraising phase, open to angel investors as of today. This initial phase offers a valuation cap, providing an excellent opportunity for value appreciation before we welcome venture capital participation in the new year. We invite you to join our Demo Day to learn more about our vision and future plans. Secure your spot and engage with our team during the follow-up Q&A session by signing up here: Demo Day Sign-up.
🇬🇧 For UK Tax Residents: We are close to obtaining SEIS/EIS Approval, which offers substantial tax advantages for early investors. With SEIS, the effective risk is just 27.5p per £1 invested, and with EIS, it's 38.5p. This effectively reduces the risk on a £50K investment to only £13.8K, maintaining all of the upside potential.
We invite our community of investors, both angels and VCs, to explore these opportunities as we prep for a robust year ahead.
The Tradewinds
Numbers & Narratives
S&P 500’s Track Record in Predicting Political Outcomes
Since 1928, the S&P 500’s performance in the three months leading up to U.S. presidential elections has aligned with election outcomes with an 87.5% accuracy rate - see image below. Across 23 election cycles, this trend suggests a close link between market sentiment and political outcomes.
The Numbers Speak
The pattern is consistent:
Market Gains Favor the Incumbent Party: Positive performance in the S&P 500 before an election typically signals continuity, with the incumbent party maintaining power.
Market Decline, Challenging Party Wins: A drop in the index often corresponds with a shift in favour of the challenging party.
This historical accuracy highlights how economic confidence—or lack thereof—can shape voter sentiment, making the S&P 500 a potential barometer of political change.
Food for Thought
For those observing this trend, a few interesting points emerge:
Sector Implications: If the market declines pre-election, certain sectors could gain momentum if a challenging party victory is expected, especially in areas like renewable energy or technology, which might align with anticipated new administration policies.
Market Reactions Post-Election: Election results often introduce volatility. If the incumbent wins following a period of market gains, sectors favored by the current administration may see reinforced support. Conversely, a challenging party victory after a downturn could prompt sector realignments in response to new policy directions.
In an election year, the S&P 500 offers unique insights into the economic sentiment surrounding political change—worth keeping in mind as the numbers unfold.
Source: InsiderFinance Wire
Market Pulse
Effects of Quantitative Tightening on Markets
Since 2022, the Federal Reserve has reduced its balance sheet by $1.5 trillion, now at about $7.5 trillion. As the Federal Reserve proceeds with quantitative tightening (QT), the policy's effects on financial markets, liquidity, and asset valuations reveal unique contrasts to quantitative easing (QE) due to structural and market asymmetries. Unlike QE, QT lacks significant announcement effects, creating subtle but impactful shifts in Treasury yields by passively allowing maturing bonds to roll off, which constrains liquidity in Treasury markets and widens swap spreads, reflecting rising volatility risks. Despite aggressive runoff caps, QT's impact is tempered by the Fed's continued long-duration holdings, which exert downward pressure on long-term yields, effectively acting as a hidden "rate cut" and complicating the tightening effect on financial conditions. Additionally, QT’s scale remains smaller than previous QE rounds, meaning its direct liquidity and inflation effects are relatively muted, though anticipated to influence future balance sheet strategies. These dynamics highlight the importance of flexible quantitative models that can adapt to ongoing policy shifts while accounting for investor responses to tightening constraints.
Politics Driving Markets
The upcoming U.S. election and the UK’s new budget each bring a wave of potential changes for financial markets, with immediate implications for currency volatility, sector investments, and cross-border trade. Already, the euro-dollar pair’s volatility has surged to levels last seen in March 2023, reflecting how markets are pricing in policy uncertainties tied to each candidate’s approach. A Trump win may bolster U.S. energy and defense stocks, with his policies favouring traditional energy giants like Exxon and defense firms like Lockheed Martin, while heightened tariffs on Chinese goods risk escalating trade tensions, complicating relations with allies like the UK. Conversely, Harris’s platform leans toward renewable energy and technology, favoring companies like Tesla and Sunrun—an alignment that mirrors the UK’s budget, which allocates £22.6bn to the NHS and increases public sector spending by 19%, funded by higher taxes on high earners and capital gains. As markets brace for these policy shifts, the record-high price of gold at $2,784.82 per ounce underscores investors’ pivot toward safe-haven assets amid rising political uncertainty. Similarly, a 0.6% dip in the Euro STOXX 600 and a 0.4% decline in British stock indices reflect the broader caution permeating markets in response to these unfolding political dynamics.
Navigational Nudges
Econometric models analyse market patterns and relationships to improve investment decisions, helping quantify market behaviour for more systematic trading approaches. Here's how to make them work for you:
Formulate Your Question:
Formulate the null hypothesis mathematically; for instance, if testing market efficiency, H0 might state that past prices do not predict future prices. Define performance metrics clearly to measure the model’s success, ensuring the chosen metrics align with the model’s objective.
Secure Quality Data:
Use automated scripts for data integrity checks, including outlier detection and missing data imputation, ensuring your inputs are reliable.
Choose the Right Model:
Evaluate models using the Akaike Information Criterion (AIC) and ensure all statistical assumptions are checked, like normality and stationarity.
Optimize Parameters:
Fine-tune model parameters using optimization techniques such as grid search, and conduct diagnostic checks to confirm the model's accuracy.
Validate and Stress Test:
Employ cross-validation to test model robustness on unseen data and perform stress tests to assess its resilience under extreme conditions.
Iterate and Implement:
Continually adjust hyperparameters and update the model with new data. Ensure model outputs are integrated smoothly into your decision-making framework.
Track and Adjust:
Set up real-time performance monitoring and adjust the model based on ongoing results and market changes.
The Knowledge Buffet
📊 The Boltzmann Equation in Finance by Michele Bogliardi and Team 📊
The complexity of financial markets often outstrips traditional modelling techniques. This paper introduces the Boltzmann Equation, traditionally a tool of statistical mechanics, to the quant toolkit, refining how we model stochastic processes and predict financial outcomes.
Using this equation, the authors offer a fresh method to account for memory effects and path dependencies in asset prices, which traditional models often overlook. Their approach not only rethinks how European call options are priced but also challenges the prevailing log-normal assumptions used in financial forecasting. Whether refining models or expanding your theoretical knowledge, this study is a great resource for anyone looking to up their financial forecasting skills with innovative techniques.
The Closing Bell
Quanted’s Pre-Seed Fundraise is now open to Angels! With early market momentum and a capped valuation, this is a prime chance to join us before the round opens to VCs in January. For UK tax residents, pending SEIS/EIS approval adds significant tax advantages, reducing effective investment risk. Join our Demo Day and Q&A by clicking below, or reach out directly at invest@quanted.com to schedule a 1:1.
Finance Fun Corner
Did you know?
Originally, there was no uniform Election Day in the U.S.; each state set its own election date for choosing presidential electors. In 1845, Congress passed a law establishing a national Election Day as the first Tuesday after the first Monday in November. This timing was chosen to allow people in agrarian societies to vote after the fall harvest and before harsh winter weather, making travel easier. Tuesday was selected to avoid Sabbath travel on Sunday, honoring religious practices
The Kickoff
Hello to our community of data enthusiasts and market innovators! November's newsletter brings fresh perspectives—from what’s next at Quanted to insights from industry leaders, surprising market connections, and practical tips for econometric modeling. Let’s get into it!
The Compass
Here's a rundown of what you can find in this edition:
A rundown of what's next for us
A surprising link between S&P & the US Elections
Timely insights to keep you in the loop on all that's happening now
How to make econometric models work for you
A fascinating paper that introduces a novel approach to handling stochastic processes
A fact we bet you did not know about the US Elections
Insider Trading
This month at Quanted has been marked by dynamic strides in data integration and exciting developments in our fundraising journey. Our ongoing commitment to enrich the Quanted Data Bridge is set to reach new heights as we integrate an extensive pipeline of esteemed data vendors. This addition will significantly enhance the analytical capabilities available to our users, allowing for more detailed and expansive insights.
In addition to broadening our data sources, we are excited to introduce a newly developed user interface designed to streamline the management of panel data. This update simplifies the extraction of actionable insights, enhancing the efficiency of our platform.
In parallel with our product advancements, we are thrilled to announce the launch of our pre-seed fundraising phase, open to angel investors as of today. This initial phase offers a valuation cap, providing an excellent opportunity for value appreciation before we welcome venture capital participation in the new year. We invite you to join our Demo Day to learn more about our vision and future plans. Secure your spot and engage with our team during the follow-up Q&A session by signing up here: Demo Day Sign-up.
🇬🇧 For UK Tax Residents: We are close to obtaining SEIS/EIS Approval, which offers substantial tax advantages for early investors. With SEIS, the effective risk is just 27.5p per £1 invested, and with EIS, it's 38.5p. This effectively reduces the risk on a £50K investment to only £13.8K, maintaining all of the upside potential.
We invite our community of investors, both angels and VCs, to explore these opportunities as we prep for a robust year ahead.
The Tradewinds
Numbers & Narratives
S&P 500’s Track Record in Predicting Political Outcomes
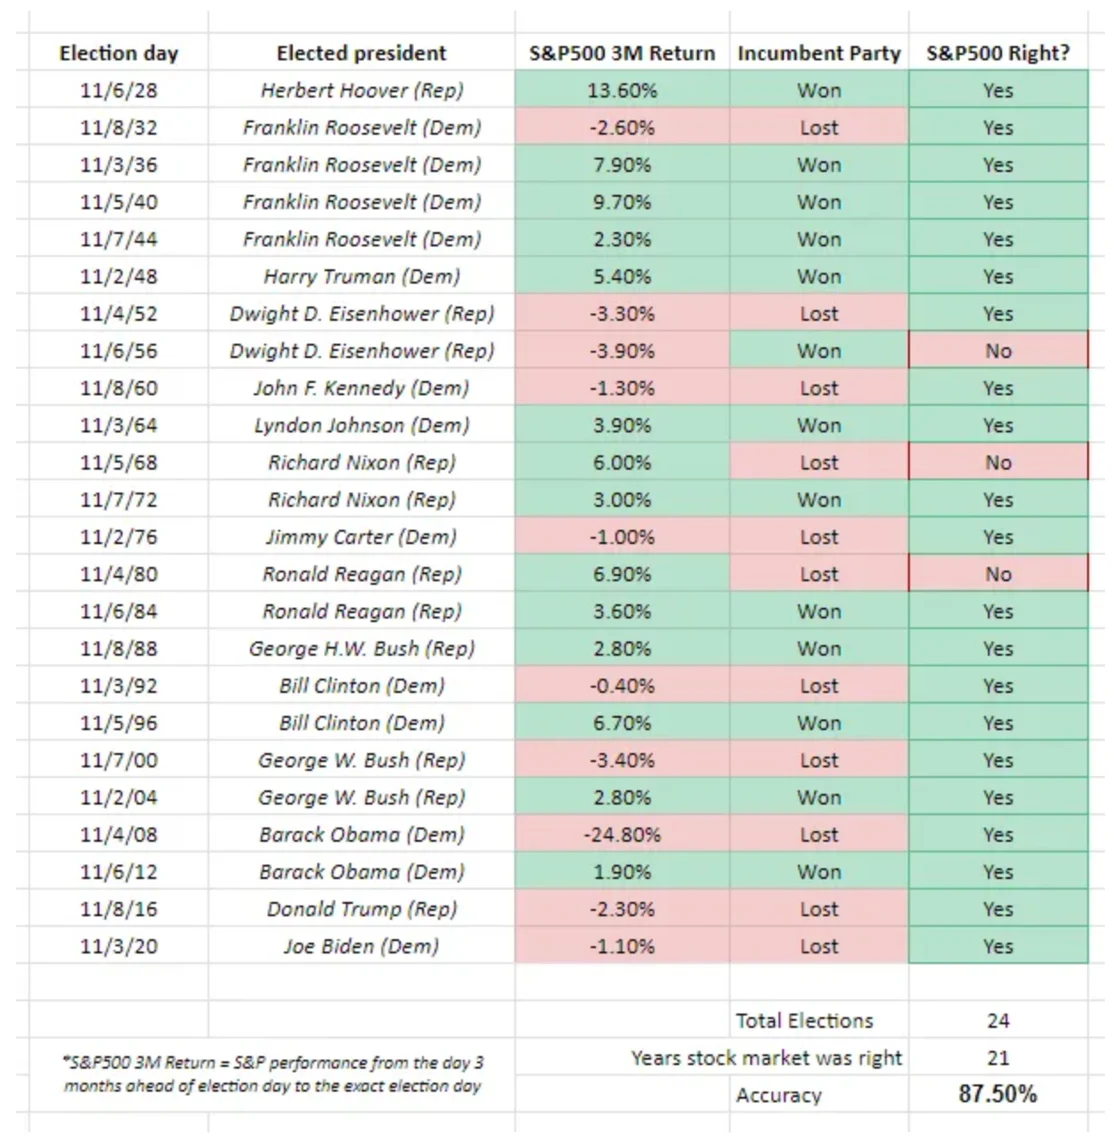
Since 1928, the S&P 500’s performance in the three months leading up to U.S. presidential elections has aligned with election outcomes with an 87.5% accuracy rate - see image below. Across 23 election cycles, this trend suggests a close link between market sentiment and political outcomes.
The Numbers Speak
The pattern is consistent:
Market Gains Favor the Incumbent Party: Positive performance in the S&P 500 before an election typically signals continuity, with the incumbent party maintaining power.
Market Decline, Challenging Party Wins: A drop in the index often corresponds with a shift in favour of the challenging party.
This historical accuracy highlights how economic confidence—or lack thereof—can shape voter sentiment, making the S&P 500 a potential barometer of political change.
Food for Thought
For those observing this trend, a few interesting points emerge:
Sector Implications: If the market declines pre-election, certain sectors could gain momentum if a challenging party victory is expected, especially in areas like renewable energy or technology, which might align with anticipated new administration policies.
Market Reactions Post-Election: Election results often introduce volatility. If the incumbent wins following a period of market gains, sectors favored by the current administration may see reinforced support. Conversely, a challenging party victory after a downturn could prompt sector realignments in response to new policy directions.
In an election year, the S&P 500 offers unique insights into the economic sentiment surrounding political change—worth keeping in mind as the numbers unfold.
Source: InsiderFinance Wire
Market Pulse
Effects of Quantitative Tightening on Markets
Since 2022, the Federal Reserve has reduced its balance sheet by $1.5 trillion, now at about $7.5 trillion. As the Federal Reserve proceeds with quantitative tightening (QT), the policy's effects on financial markets, liquidity, and asset valuations reveal unique contrasts to quantitative easing (QE) due to structural and market asymmetries. Unlike QE, QT lacks significant announcement effects, creating subtle but impactful shifts in Treasury yields by passively allowing maturing bonds to roll off, which constrains liquidity in Treasury markets and widens swap spreads, reflecting rising volatility risks. Despite aggressive runoff caps, QT's impact is tempered by the Fed's continued long-duration holdings, which exert downward pressure on long-term yields, effectively acting as a hidden "rate cut" and complicating the tightening effect on financial conditions. Additionally, QT’s scale remains smaller than previous QE rounds, meaning its direct liquidity and inflation effects are relatively muted, though anticipated to influence future balance sheet strategies. These dynamics highlight the importance of flexible quantitative models that can adapt to ongoing policy shifts while accounting for investor responses to tightening constraints.
Politics Driving Markets
The upcoming U.S. election and the UK’s new budget each bring a wave of potential changes for financial markets, with immediate implications for currency volatility, sector investments, and cross-border trade. Already, the euro-dollar pair’s volatility has surged to levels last seen in March 2023, reflecting how markets are pricing in policy uncertainties tied to each candidate’s approach. A Trump win may bolster U.S. energy and defense stocks, with his policies favouring traditional energy giants like Exxon and defense firms like Lockheed Martin, while heightened tariffs on Chinese goods risk escalating trade tensions, complicating relations with allies like the UK. Conversely, Harris’s platform leans toward renewable energy and technology, favoring companies like Tesla and Sunrun—an alignment that mirrors the UK’s budget, which allocates £22.6bn to the NHS and increases public sector spending by 19%, funded by higher taxes on high earners and capital gains. As markets brace for these policy shifts, the record-high price of gold at $2,784.82 per ounce underscores investors’ pivot toward safe-haven assets amid rising political uncertainty. Similarly, a 0.6% dip in the Euro STOXX 600 and a 0.4% decline in British stock indices reflect the broader caution permeating markets in response to these unfolding political dynamics.
Navigational Nudges
Econometric models analyse market patterns and relationships to improve investment decisions, helping quantify market behaviour for more systematic trading approaches. Here's how to make them work for you:
Formulate Your Question:
Formulate the null hypothesis mathematically; for instance, if testing market efficiency, H0 might state that past prices do not predict future prices. Define performance metrics clearly to measure the model’s success, ensuring the chosen metrics align with the model’s objective.
Secure Quality Data:
Use automated scripts for data integrity checks, including outlier detection and missing data imputation, ensuring your inputs are reliable.
Choose the Right Model:
Evaluate models using the Akaike Information Criterion (AIC) and ensure all statistical assumptions are checked, like normality and stationarity.
Optimize Parameters:
Fine-tune model parameters using optimization techniques such as grid search, and conduct diagnostic checks to confirm the model's accuracy.
Validate and Stress Test:
Employ cross-validation to test model robustness on unseen data and perform stress tests to assess its resilience under extreme conditions.
Iterate and Implement:
Continually adjust hyperparameters and update the model with new data. Ensure model outputs are integrated smoothly into your decision-making framework.
Track and Adjust:
Set up real-time performance monitoring and adjust the model based on ongoing results and market changes.
The Knowledge Buffet
📊 The Boltzmann Equation in Finance by Michele Bogliardi and Team 📊
The complexity of financial markets often outstrips traditional modelling techniques. This paper introduces the Boltzmann Equation, traditionally a tool of statistical mechanics, to the quant toolkit, refining how we model stochastic processes and predict financial outcomes.
Using this equation, the authors offer a fresh method to account for memory effects and path dependencies in asset prices, which traditional models often overlook. Their approach not only rethinks how European call options are priced but also challenges the prevailing log-normal assumptions used in financial forecasting. Whether refining models or expanding your theoretical knowledge, this study is a great resource for anyone looking to up their financial forecasting skills with innovative techniques.
The Closing Bell
Quanted’s Pre-Seed Fundraise is now open to Angels! With early market momentum and a capped valuation, this is a prime chance to join us before the round opens to VCs in January. For UK tax residents, pending SEIS/EIS approval adds significant tax advantages, reducing effective investment risk. Join our Demo Day and Q&A by clicking below, or reach out directly at invest@quanted.com to schedule a 1:1.
Finance Fun Corner
Did you know?
Originally, there was no uniform Election Day in the U.S.; each state set its own election date for choosing presidential electors. In 1845, Congress passed a law establishing a national Election Day as the first Tuesday after the first Monday in November. This timing was chosen to allow people in agrarian societies to vote after the fall harvest and before harsh winter weather, making travel easier. Tuesday was selected to avoid Sabbath travel on Sunday, honoring religious practices